RSI vs Bollinger Bands (MT4)
RSI vs Bollinger Bands overlays Bollinger Bands on RSI (or maps RSI vs price bands) to spot momentum extremes and mean‑reversion vs trend‑continuation conditions in MetaTrader 4.
What it shows
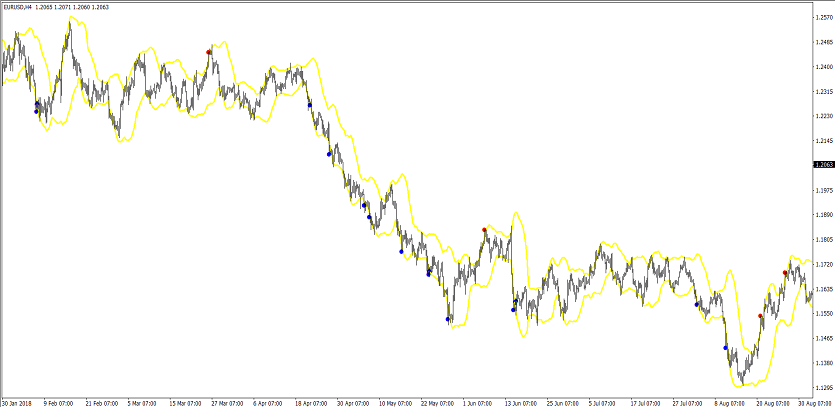
- RSI line with Bollinger envelope (on RSI space), highlighting band touches/breaks and midline (50) flips.
- OB/OS guides — classic 70/30 (optional 80/20), plus band width as a volatility gauge.
- (Optional) arrows/alerts — band touch/exit, midline cross, slope flip, and band squeeze/expansion.
Trade ideas
- Squeeze breakout: when RSI bands contract, look for a midline + band break in the same direction; ride the push.
- Extreme fade: in ranges, fade RSI outer‑band spikes back toward the midline/center.
- Trend‑aligned pullback: in uptrends, buy pullbacks that hold above the lower band and RSI>50 (mirror for downtrends).
- (Optional) Confluence: add MA/structure; bands visualize volatility regime.
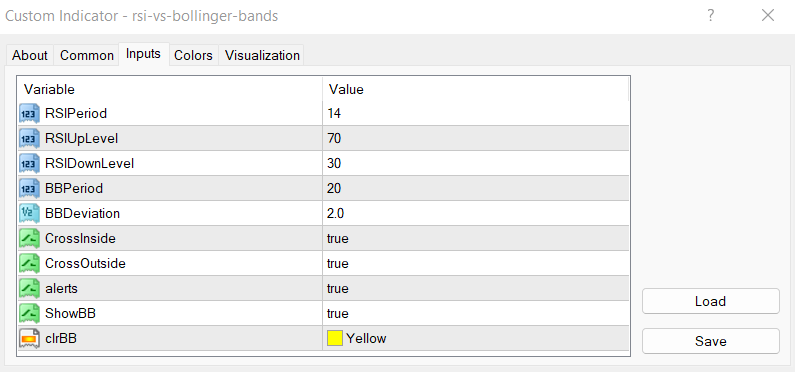
Inputs that matter
- RSI period — responsiveness vs stability (14 default).
- Band period & deviation — envelope tightness.
- Apply to — RSI value or price‑relative mapping (build may vary by version).
- Alerts — band touch/exit, 50 cross, slope change, squeeze.
- Colors/widths — fast visual read.
Suggested usage
- M5–M15: squeeze breakouts and quick fades.
- M30–H4: trend pullbacks and band walks.
- Daily+: regime map and risk tilt.
Installation (MT4)
- Open MetaTrader 4 → File → Open Data Folder.
- Copy
rsi-vs-bollinger-bands.ex4to MQL4/Indicators. - Restart MT4 (or refresh Navigator) and attach RSI vs Bollinger Bands.
- Tweak inputs → OK.
FAQ
Does it repaint? No on closed bars.
Use in EAs? Yes, via iCustom.
Markets? FX, indices, metals, crypto — anything on MT4.
Disclaimer: Test on a demo account first; risk management is essential.